


Zero-Waste Manufacturer Assessment Tool
This tool helps plastic manufacturers assess their current practices against zero-waste standards. By answering a few questions about your operations, you'll get a score and personalized recommendations to improve your circular economy alignment.
Your Zero-Waste Alignment Assessment
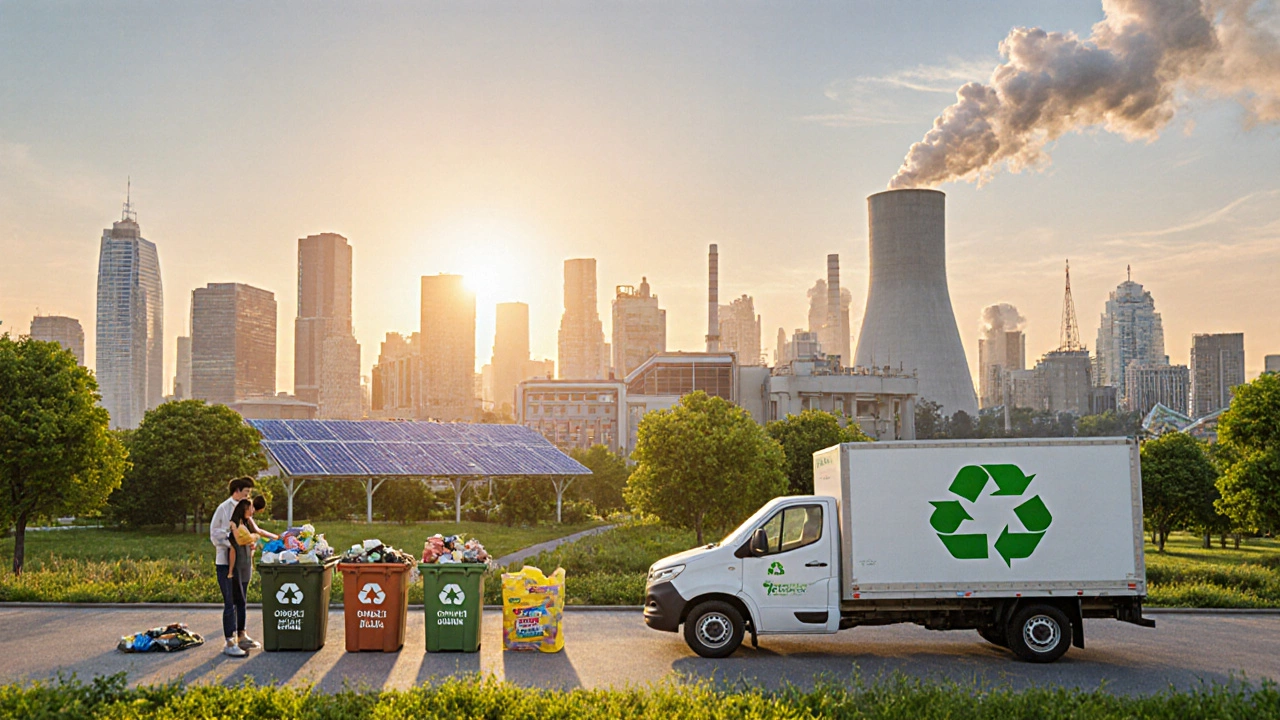
When you hear the phrase zero waste country, you probably picture a nation that never tosses anything into a landfill. In reality, zero‑waste status is a moving target, measured by how much material a nation recycles, composts, or re‑uses versus what ends up as waste. This article breaks down the countries that are closest to true zero waste, explains the policies that get them there, and shows why plastic manufacturers should care.
What "zero waste" Actually Means
Zero waste is a philosophy and set of practical strategies that aim to redesign systems so that all resources are kept in use for as long as possible, and no material is sent to landfill or incineration. The concept rests on five core principles: redesign, reduce, reuse, recycle, and compost. Countries score points when they achieve high recycling rates, strong product‑take‑back schemes, and robust composting infrastructure.
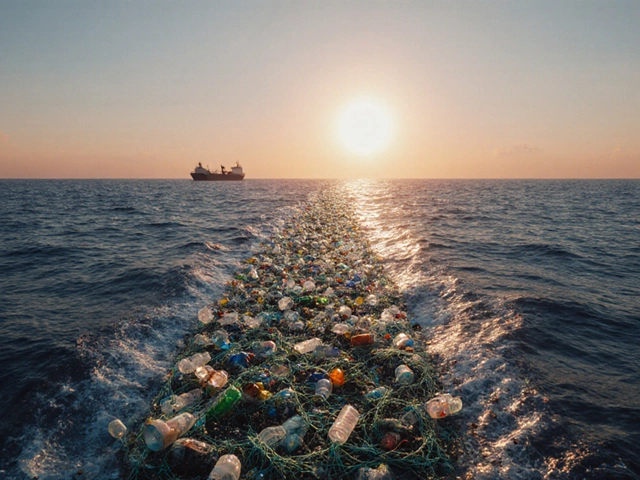
Why Plastic Manufacturers Should Watch the Zero‑Waste Race
Plastic producers sit at the center of the waste loop. When a country adopts strict zero‑waste goals, manufacturers must shift from single‑use designs to reusable or recyclable solutions, adopt Extended Producer Responsibility (EPR) programs, and invest in closed‑loop recycling. Those changes can reshape supply chains, create new revenue streams, and open access to markets that demand greener packaging.
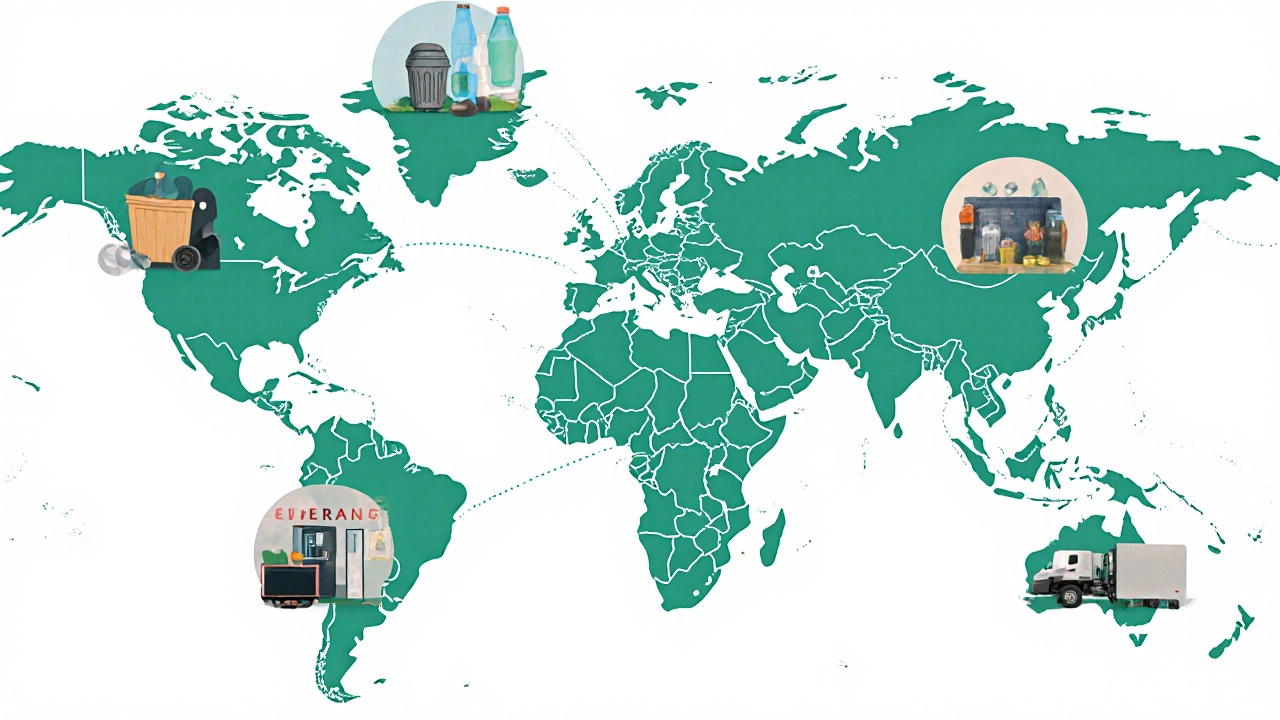
Countries Leading the Pack (2025 Data)
Below is a snapshot of the nations that have the highest overall waste‑diversion performance. Figures combine municipal solid waste (MSW) generation per capita, recycling rates, and the presence of national zero‑waste legislation.
| Country | MSW per capita (kg/year) | Overall diversion rate | Key policies |
|---|---|---|---|
| Sweden | 450 | 99% | Pay‑as‑you‑throw, nationwide composting, strong EPR for packaging |
| Japan | 400 | 98% | Mandatory recycling of PET bottles, strict landfill bans for plastic |
| Slovenia | 320 | 97% | Zero‑waste policy (2021), high reuse rate for glass and metal |
| South Korea | 360 | 96% | Volume‑based waste fees, nationwide food‑waste composting |
| Germany | 430 | 95% | Packaging Act (2022), dual‑system waste collection |
| Netherlands | 380 | 94% | Zero‑Waste Amsterdam initiative, high circular‑economy targets |
| Bhutan | 210 | 90% | Constitutional commitment to Gross National Happiness, strict plastic ban |
How These Nations Got to Zero‑Waste Status
Even the top performers didn’t achieve their scores overnight. Here are the common levers they pulled:
- Pay‑as‑you‑throw (PAWT) fees: Charging households for the amount of waste they discard creates a direct financial incentive to recycle.
- Extended Producer Responsibility (EPR): Manufacturers fund collection and recycling of their packaging. Sweden and Germany have some of the toughest EPR schemes, forcing producers to design for recyclability.
- National recycling targets: Legal mandates-like Japan’s 100% PET bottle recycling goal-set clear expectations and drive infrastructure investment.
- Organic waste composting: Countries such as South Korea separate food waste at the source, turning it into fertilizer instead of landfill fuel.
- Public‑private partnerships: The Netherlands leverages city‑level pilots (e.g., Zero‑Waste Amsterdam) that scale successful models nation‑wide.
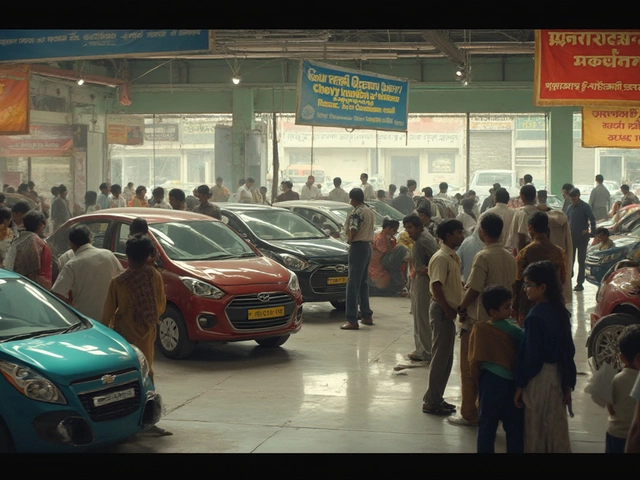
What This Means for Plastic Manufacturing Companies
If you run a plastic production line, the zero‑waste landscape reshapes three core areas:
- Product design: Design for easier separation-like mono‑material packaging or easy‑open closures-reduces contamination rates during recycling.
- Supply‑chain contracts: EPR laws require manufacturers to report material flows. Transparent tracking systems become essential.
- Market access: Retailers in zero‑waste markets demand reusable or refillable solutions. Companies that invest now can secure contracts before the competition catches up.
For example, a Swedish beverage company switched to a 100% recyclable PET bottle made from 30% post‑consumer material. The move cut raw‑material costs by 12% and qualified the brand for the national "Recycling Champions" grant.

Practical Steps for Manufacturers Looking to Align with Zero‑Waste Nations
Below is a quick‑start checklist you can adopt whether you’re based in the UK or exporting to zero‑waste markets.
- Audit material streams: Map every kilogram of plastic from resin to end‑of‑life.
- Adopt design for recycling (DfR): Use mono‑layer films, avoid mixed polymers, and label recyclability clearly.
- Partner with certified recyclers: Secure contracts with facilities that meet OECD recycling standards.
- Implement take‑back schemes: Offer refill stations or mail‑back programs for high‑volume packaging.
- Report to regulators: Align data reporting with the EU Packaging and Packaging Waste Directive (2024 amendment) and similar EPR frameworks.
These actions not only reduce compliance risk but also open up cost‑saving opportunities through material circularity.
Key Takeaways
- Sweden, Japan, and Slovenia top the 2025 zero‑waste rankings, boasting diversion rates above 95%.
- Strong PAWT fees, EPR laws, and national recycling targets are the common drivers.
- Plastic manufacturers must redesign products for recyclability, adopt transparent reporting, and engage in take‑back programs to stay competitive.
- Implementing the checklist above can help companies meet both regulatory demands and market expectations in zero‑waste nations.
Frequently Asked Questions
Which country has achieved the highest recycling rate?
Sweden leads with a 99% overall waste‑diversion rate, thanks to comprehensive PAWT fees and a nationwide composting network.
Can a country truly be "zero waste"?
No nation reaches absolute zero waste, but many achieve near‑zero levels where less than 1% of waste ends up in landfill or incineration. The goal is continuous improvement.
How does Extended Producer Responsibility affect plastic makers?
EPR shifts the cost of collection and recycling onto producers, pushing them to design more recyclable packaging and fund take‑back schemes.
What is the biggest challenge for plastic manufacturers entering zero‑waste markets?
Balancing cost, performance, and recyclability. High‑density polymers offer durability but are harder to recycle; switching to mono‑material solutions often requires re‑tooling.
Are there financial incentives for companies that meet zero‑waste standards?
Yes. Nations like Sweden and Germany offer grants, tax breaks, and preferential procurement for firms that demonstrate high‑level circular‑economy practices.


Write a comment