


Plastic Pollution Tracker
| Rank | Country | Total Plastic Generated | Mismanaged Plastic | Ocean Entry | Key River(s) |
|---|---|---|---|---|---|
| 1 | China | 120 Mt | 12% | 1.2 Mt | Yangtze, Pearl River |
| 2 | Indonesia | 15 Mt | 38% | 0.8 Mt | Mahakam, Citarum |
| 3 | Philippines | 10 Mt | 40% | 0.6 Mt | Pasig, Cagayan |
| 4 | Vietnam | 12 Mt | 30% | 0.5 Mt | Mekong, Red River |
| 5 | Sri Lanka | 5 Mt | 45% | 0.45 Mt | Kalu Ganga |
China leads primarily due to:
- Massive production volume (28% of global plastic)
- Large urban-rural waste gap
- Powerful river export systems like the Yangtze
Small countries like Sri Lanka rank high due to:
- High per-capita mismanagement rates
- Weak waste collection systems
- High proportion of unmanaged waste
- Yangtze (China)
- Ganges (India)
- Indus (Pakistan)
- Nile (Egypt)
- Yellow River (China)
- Mekong (Vietnam/Laos/Cambodia/Thailand)
- Citarum (Indonesia)
- Lena (Russia)
- Upper Niger (Mali)
- Amazon (Brazil)
These rivers carry approximately 90% of ocean-bound plastic.
Policy Frameworks
Extended Producer Responsibility (EPR) laws ensure manufacturers fund recycling and collection systems.
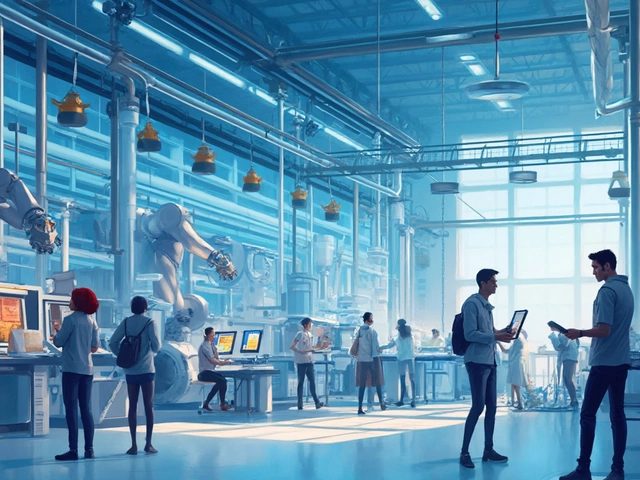
Infrastructure
Improved collection systems and river interceptors reduce plastic flow into oceans.
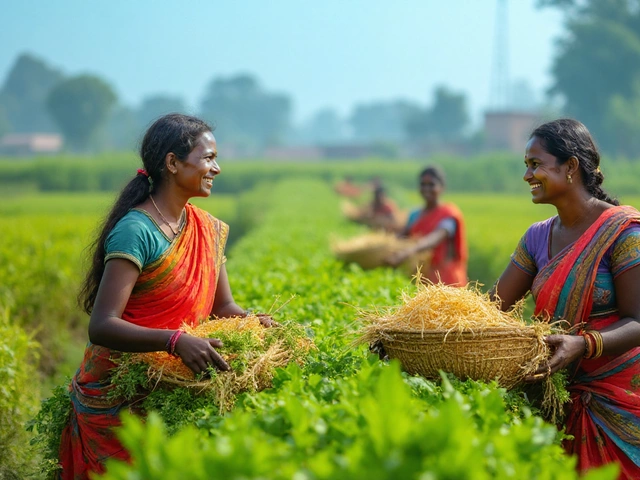
Public Awareness
Campaigns and education reduce plastic consumption and promote sustainable practices.
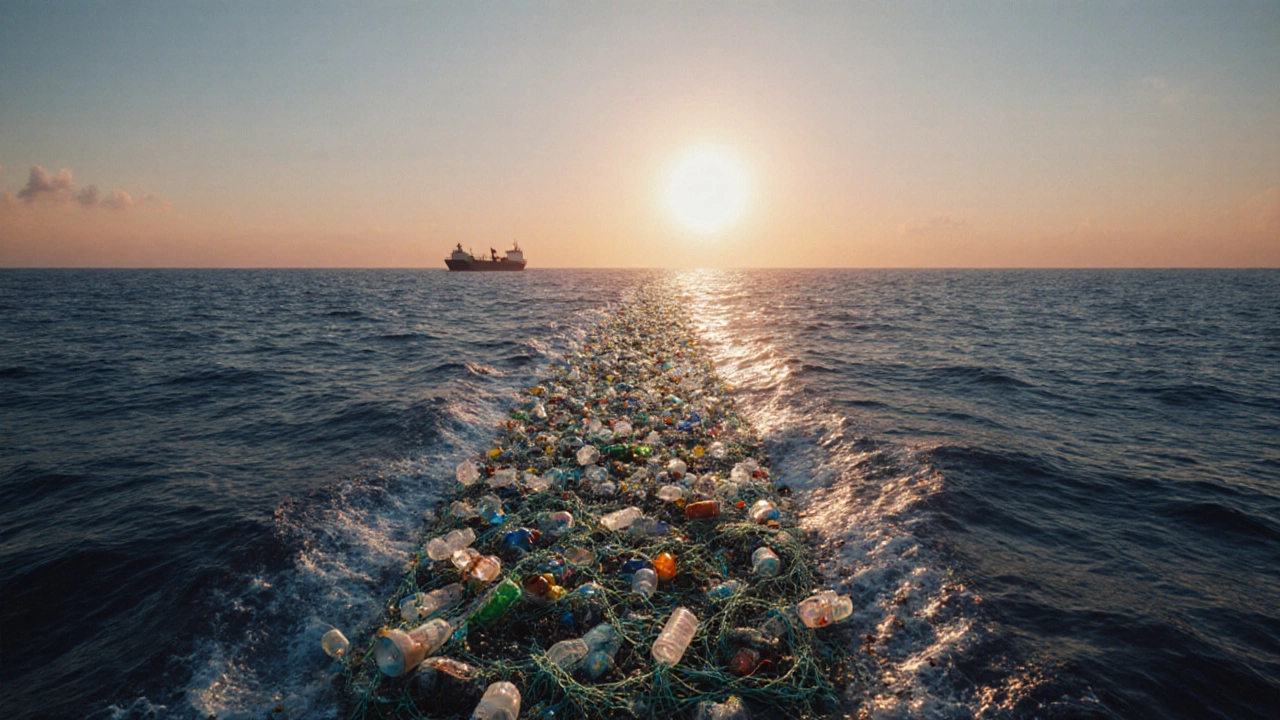
Every year millions of tonnes of plastic slip through our waste systems and end up swirling in the world’s oceans. Pinpointing the nation that contributes the most helps policymakers, NGOs, and businesses target the biggest leaks. Below we break down the latest data, explain why the numbers look the way they do, and show what can be done to turn the tide.
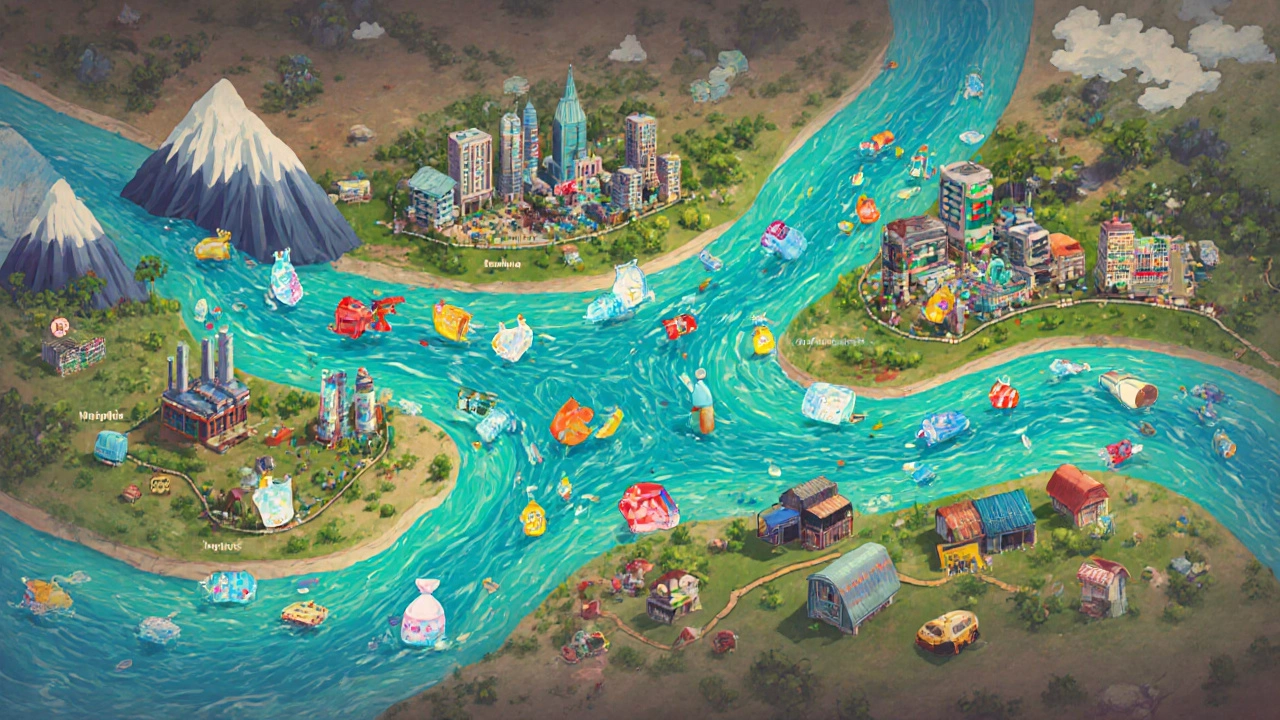
How Plastic Travels From Land to Sea
Plastic doesn’t magically appear in the water; it follows a chain of weak points:
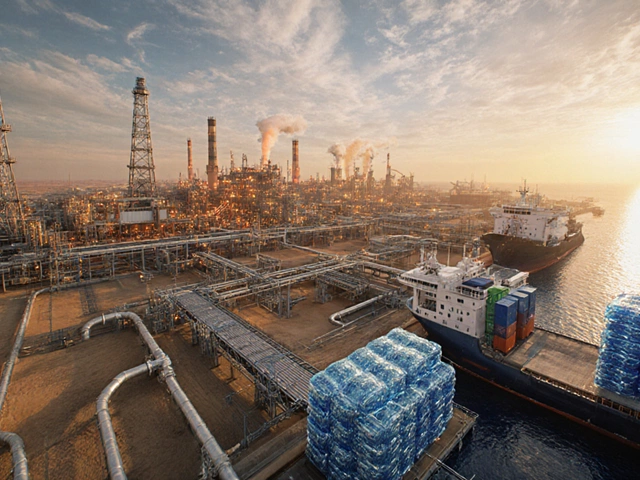
- Production and consumption - billions of plastic items are made, used, and discarded each year.
- Mismanaged waste - when collection, recycling, or landfill systems fail, plastic piles up on streets, in rivers, or on beaches.
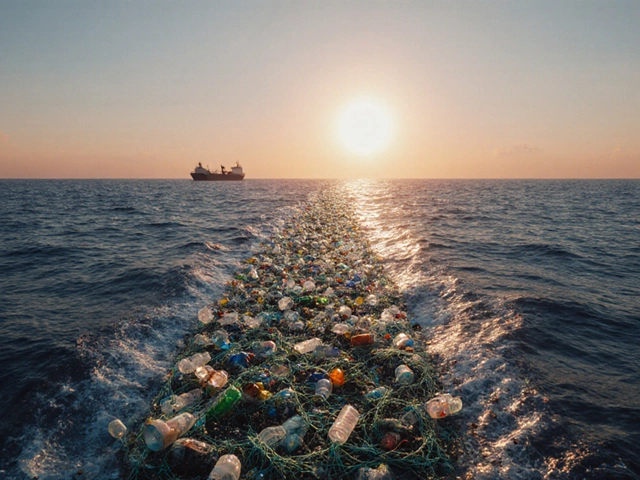
- River transport - flowing water carries debris downstream, often converging into a handful of major rivers that empty directly into the ocean.
- Coastal dumping - in many developing regions, waste is burned, buried, or simply left on the coastline, where tides sweep it out to sea.
Understanding each step is crucial because tackling the problem at the source (production and consumption) is far more effective than trying to fish plastics out of the open water.
Where the Numbers Come From
The most widely cited figures are compiled by the World Bank in partnership with the United Nations Environment Programme (UNEP). Their 2022 "What a Waste" report estimates mismanaged plastic waste for every country, then projects how much of that waste is likely to enter the ocean based on river flow and coastal dynamics.
Key attributes they consider:
- Total plastic generated - measured in million tonnes per year.
- Mismanagement rate - percentage of generated plastic that isn’t collected, recycled, or safely disposed of.
- River‑to‑ocean export factor - how effectively a country’s river network transports waste to the sea.
These variables are plugged into a model that yields an estimate of “plastic entering the ocean” per country. While the model has uncertainties (e.g., informal waste streams are hard to quantify), it provides the best global snapshot we have.
Top Five Countries by Plastic Entering the Ocean
| Rank | Country | Total Plastic Generated | Mismanaged Plastic | Estimated Ocean Entry | Key River(s) |
|---|---|---|---|---|---|
| 1 | China | 120Mt | 12% | 1.2Mt | Yangtze, Pearl River |
| 2 | Indonesia | 15Mt | 38% | 0.8Mt | Mahakam, Citarum |
| 3 | Philippines | 10Mt | 40% | 0.6Mt | Pasig, Cagayan |
| 4 | Vietnam | 12Mt | 30% | 0.5Mt | Mekong, Red River |
| 5 | Sri Lanka | 5Mt | 45% | 0.45Mt | Kalu Ganga |
China tops the list mainly because of its sheer volume of plastic production. Even with a relatively low mismanagement rate, the 120million tonnes of plastic it manufactures each year translate into over a million tonnes of waste that eventually reaches the ocean.
Why China Leads - A Closer Look
China’s position isn’t a moral indictment; it’s a statistical outcome of three factors:
- Scale of production - the country produces roughly 28% of the world’s plastic, dwarfing every other nation.
- Urban‑rural waste gap - rural areas often lack proper collection services, pushing a sizable share of waste into waterways.
- River export power - the Yangtze River alone transports about 1.3million tonnes of plastic to the East China Sea each year, acting as a massive conveyor belt.
Recent policy shifts, such as the 2023 ban on single‑use plastics in major cities and the launch of the “National Sword” recycling program, are starting to curb the flow, but the momentum built over decades won’t reverse overnight.
Quantity vs. Per‑Capita: The Nuance That Matters
If you slice the data per person, the picture changes dramatically. Smaller, low‑income nations often have the highest per‑capita mismanaged plastic rates. For example, Sri Lanka contributes less total waste than China, but its per‑capita mismanagement rate exceeds 45%-one of the world’s highest.
Why does this distinction matter?
- Donor agencies and NGOs can target funding to nations where a single change will shift a large share of waste.
- Consumers in high‑production countries may feel less personal responsibility, even though their collective impact dominates.
- Policy frameworks need to address both scale (total tonnes) and efficiency (per‑capita mismanagement).
The Rivers That Deliver Plastic to the Sea
Research by The Ocean Cleanup identified ten rivers responsible for about 90% of the plastic flowing into the ocean. They are:
- Yangtze (China)
- Ganges (India)
- Indus (Pakistan)
- Nile (Egypt)
- Yellow River (China)
- Yangtze (duplicate for emphasis on volume)
- Mekong (Vietnam/Laos/Cambodia/Thailand)
- Citarum (Indonesia)
- Lena (Russia)
- Upper Niger (Mali)
Targeting cleanup and waste‑capture infrastructure along these waterways offers a high return on investment. Pilot projects in the Citarum have already reduced local plastic concentrations by up to 30%.
What Can Be Done - From Policy to Personal Action
Reducing ocean plastic is a shared responsibility. Here are six levers that have shown measurable results:
- Extended Producer Responsibility (EPR) - laws that make manufacturers finance collection and recycling. The EU’s 2025 EPR directive expects a 30% rise in recycled plastic content.
- Improved collection infrastructure - low‑cost, community‑run sorting hubs in rural China have lifted collection rates from 45% to 62% in pilot zones.
- River interceptors - floating barriers like the “Interceptor 001” in Jakarta have captured over 30000kg of plastic in a single year.
- Consumer awareness campaigns - the “Beat Plastic Pollution” drive in Indonesia cut single‑use bag usage by 25% within six months.
- Alternative materials - bio‑based polymers that fully biodegrade in marine environments are being scaled by companies in Vietnam.
- International cooperation - the 2024 UN Marine Litter Treaty sets shared targets for 2030, including a 70% reduction in mismanaged waste for the top five polluting nations.
Each step tackles a different part of the waste chain, ensuring that solutions are not just a band‑aid but a systemic overhaul.
Quick Takeaways
- China contributes the most plastic to the ocean, largely because of its massive production volume.
- Indonesia, the Philippines, Vietnam, and Sri Lanka round out the top five.
- Per‑capita mismanagement paints a different risk map, highlighting smaller nations with weak waste services.
- Ten rivers, especially the Yangtze and Citarum, act as the main highways for plastic export.
- Effective mitigation blends policy, infrastructure, technology, and public behavior.
Frequently Asked Questions
Which country produces the most plastic overall?
China manufactures roughly 28% of the world’s plastic, making it the top producer by a wide margin.
Why do small countries like Sri Lanka appear in the top polluters?
They have very high per‑capita mismanagement rates. A large share of the little plastic they generate ends up in the ocean, inflating their rank relative to total tonnes.
Can river‑interceptor projects really make a difference?
Yes. Early installations in Jakarta and Ho Chi Minh City have removed tens of thousands of kilograms of plastic that would otherwise flow to the sea, proving the concept scalable.
What is Extended Producer Responsibility (EPR) and how does it help?
EPR makes manufacturers financially responsible for the end‑of‑life stage of their products. This incentivizes better product design, higher recycled content, and funding for collection systems.
How reliable are the estimates of ocean‑bound plastic?
The figures are based on the World Bank’s global waste‑flow model, which uses satellite data, river discharge statistics, and national waste‑management reports. While there’s uncertainty-especially for informal sectors-the methodology is the most comprehensive available.
Write a comment