

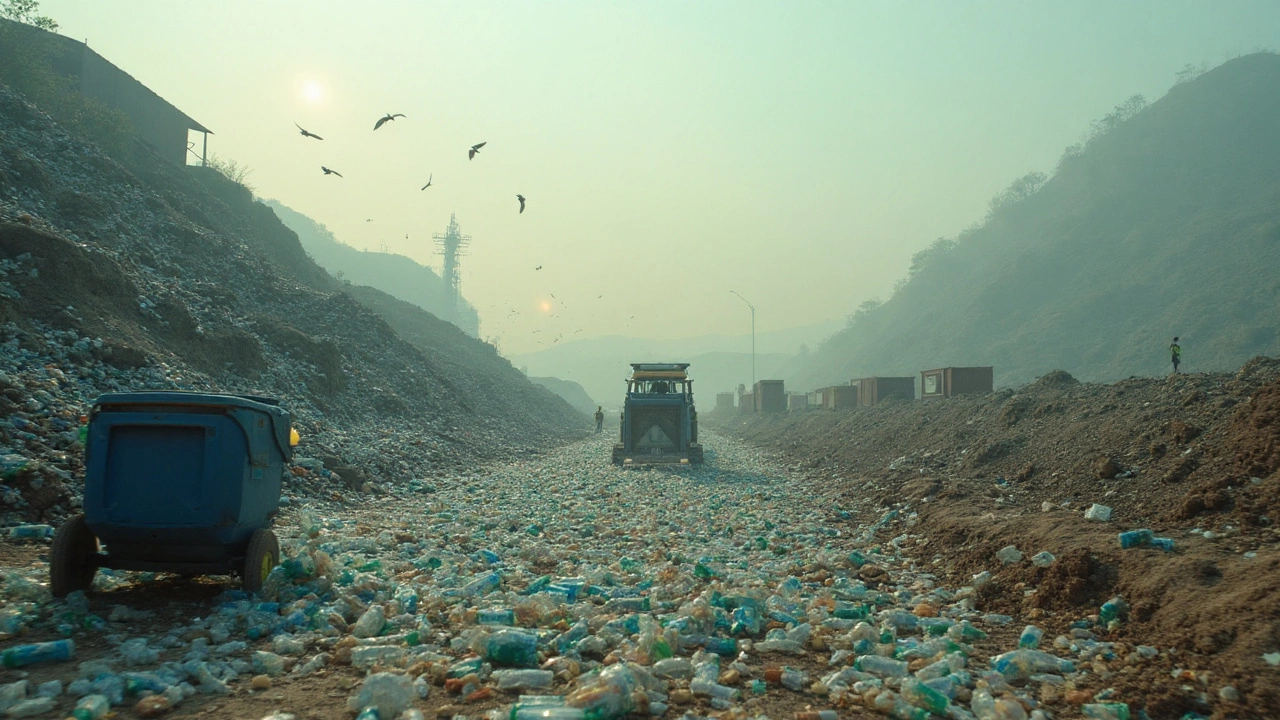

Here’s the blunt truth: most of what you drop in the blue bin won’t come back as a bottle. The US makes tens of millions of tons of plastic trash every year, and the system still sends the bulk of it to landfills or the burner. Exports have shrunk since China’s 2018 ban, but they haven’t vanished. If you want the real map of where it all ends up-and how to bend your own footprint toward better outcomes-this breaks it down without the sugarcoating.
- TL;DR: In 2025, the largest share of US plastic waste goes to landfills (about 70-75%). Energy-from-waste incinerators take roughly 12-18%. Actual recycling lands in the low single digits to high single digits (about 5-9%), mostly for PET (#1) and HDPE (#2). Exports of plastic scrap are down from 2017 peaks but still around 0.7-1.0 million tons a year-mainly to Canada, Mexico, and a smaller mix of Asian markets.
- “Recyclable” on the label doesn’t mean it gets recycled. Only a few formats have steady domestic markets: clear PET bottles and HDPE jugs. Clamshells, films, foam, and black plastics are long shots.
- Contamination is the system’s silent killer. A city’s curbside stream often has 17-25% junk. Clean, simple packaging survives; mixed, dirty, and tiny pieces get tossed.
- You can change the destination. Prioritize reusable/refill formats, buy only truly recyclable plastics (#1 bottles and #2 jugs), and use store drop-offs for bags/film. Businesses: lock in end markets with contracts and proof, not just wishful specs.
- Data is messy and lags. The patterns below are based on US EPA, National Academies, GAO, and trade data through 2024-2025. Ranges are honest, not hedged.
Where US plastic waste actually goes in 2025
The US generates a lot of plastic trash-on the order of 40-45 million tons a year. The National Academies reported the US was the top generator as far back as 2016, and the trend line hasn’t reversed. So where does it all land?
Below is a snapshot that reflects the current mix, blending the most recent US EPA “Facts and Figures” baseline (which still leans on 2018 methodology), the Government Accountability Office (2023), National Academies (2022), and 2022-2024 trade data. Think of the numbers as ranges that capture how the system behaves now.
| Destination | Share of US plastic waste | What it means in practice | Notes / sources |
|---|---|---|---|
| Landfill | ~70-75% | Most plastics are buried. Dirty, mixed, or non-marketable items get landfilled at MRFs and transfer stations. | EPA (2018 baseline ~76% landfilled for plastics); patterns hold; higher generation since. |
| Incineration (energy-from-waste) | ~12-18% | Burned for electricity/steam in ~60-70 WTE plants; plastics boost heat value. | Energy Recovery Council data; EPA MSW combustion share; plastics over-index in WTE feed by BTU. |
| Domestic mechanical recycling | ~4-7% | Mostly PET (#1) bottles and HDPE (#2) jugs; some PP (#5) rising from a low base. | GAO (2023) notes plastics recycling in low single digits; Beyond Plastics/Last Beach Cleanup (2022) estimated ~5-6% in 2021. |
| Exports of plastic scrap | ~1-2% of total waste (10-20% of what’s “recovered”) | Baled plastics shipped mainly to Canada, Mexico; smaller flows to Malaysia, India, Vietnam, Indonesia. | US Census/UN Comtrade: ~0.7-1.0 million tons/yr in 2022-2024; down sharply since 2017. |
| Chemical/advanced recycling | <1% | Pyrolysis/depolymerization at pilot/commercial scale; volumes small, project-by-project. | GAO (2023) and state filings; scaling and emissions under review. |
| Environmental leakage | Unquantified share | Litter, illegal dumping, stormwater losses, microplastics from tires and textiles. | National Academies (2022) flags significant US contribution to plastic in the environment. |
Why the spread on the numbers? Because every step filters material. Here’s the typical path:
- You put an item in the bin. If your program accepts it and it’s empty, it travels.
- A MRF (materials recovery facility) sorts it. Non-accepted shapes, black plastics, small items, and dirty items get ejected.
- Acceptable plastics get baled by resin/format-like PET bottles or HDPE jugs.
- Bales go to domestic reclaimers or overseas mills. If there’s no buyer, they get stockpiled or landfilled.
Exports today are a fraction of what they were in 2017. China’s National Sword policy and 2021 Basel Convention changes slammed the door on contaminated loads. The US isn’t a Basel party, but most destination countries are-so shipments now require consent and better quality. Canada and Mexico are the top recipients because of proximity and integrated manufacturing. The occasional headlines about Malaysia or Turkey still pop up, but it’s a smaller slice and more tightly policed than before.
What about microplastics? They don’t come just from packaging. Tire wear and synthetic fiber shedding dominate many urban watersheds. Even perfect recycling wouldn’t stop those streams on its own, which is why “where it ends up” also includes storm drains and sediments.
Data sources you can trust if you want to dig deeper: US EPA Advancing Sustainable Materials Management (latest tables), GAO’s 2023 report on plastic recycling, the National Academies’ 2022 assessment of the US role in ocean plastic, UN Comtrade/Census trade data, and The Recycling Partnership’s annual State of Curbside report.
What “recycling” really means: from your bin to (maybe) a new bottle
Labels and chasing arrows sell a story. Markets decide the truth. Here’s what that looks like on the ground.
Step-by-step reality check
- Collection: Single-stream makes it easy for you, hard for the plant. Contamination at the curb averages 17-25% in many cities (The Recycling Partnership, 2022-2024). Bagged recyclables, food gunk, tanglers (hoses, cords), and tiny bits are common culprits.
- Sorting: Optical sorters target PET and HDPE. Black plastics don’t reflect well, so they often miss. Films wrap around screens and jam the line.
- Baling: The plant sells bales that meet a buyer’s spec. When prices drop, borderline materials (like PET clamshells) get deprioritized.
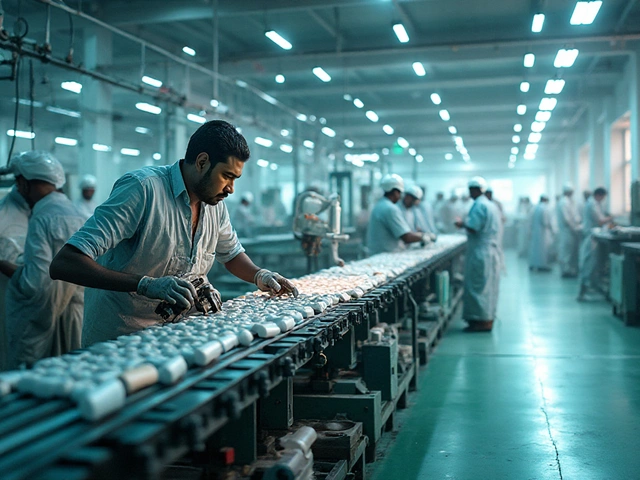
- Reclaiming: Clean flakes or pellets are made and sold into packaging, fiber, or strapping. Food-contact approval is tight; only some streams hit it.
- Remanufacturing: Bottles, pipes, crates, carpet, or clothing get made. A bottle-to-bottle loop for PET exists, but not for most other resins.
What actually gets recycled
- PET (#1) bottles: Best shot at becoming new bottles or fiber. Clear bottles are gold. Colored and opaque PET struggle.
- HDPE (#2) jugs: Milk jugs (natural) are highly valued; colored HDPE gets used for pipe, lumber, or non-food packaging.
- PP (#5): Growing, but patchy. Some cities accept it, demand is improving for tubs and closures.
- LDPE film (#4): Curbside is usually a no. Store drop-off works in many regions. Film needs to be clean and dry.
- PS (#6) and PVC (#3): Rarely recycled curbside. Foam foodware is almost always trash.
Heuristics that won’t steer you wrong
- If it’s a bottle with a neck (water, soda, milk), empty it, put the cap back on, and recycle it.
- If it’s a clam shell (berries, salad), check your local list. Many MRFs still don’t want them.
- Film, bags, bubble wrap: Don’t put them in curbside unless your city explicitly says yes. Use store drop-off if available.
- Black, foam, utensils, straws: Trash in most places.
- Size rule: Anything smaller than a credit card tends to fall through sorting screens-trash it.
- Clean-ish is enough: A quick rinse and a shake. No need to scrub. Food residue can spoil a whole bale.
Advanced (chemical) recycling-what’s real today
Projects that turn hard-to-recycle plastics into oil or monomers are expanding, but they’re still a rounding error in the national flow. Through 2024, most facilities were pilots or early commercial sites with limited throughput. GAO’s 2023 review called out scale and emissions questions that states are still sorting out. If and when these plants run steadily, expect them to target cleaner industrial streams first, not your greasy takeout clamshell.
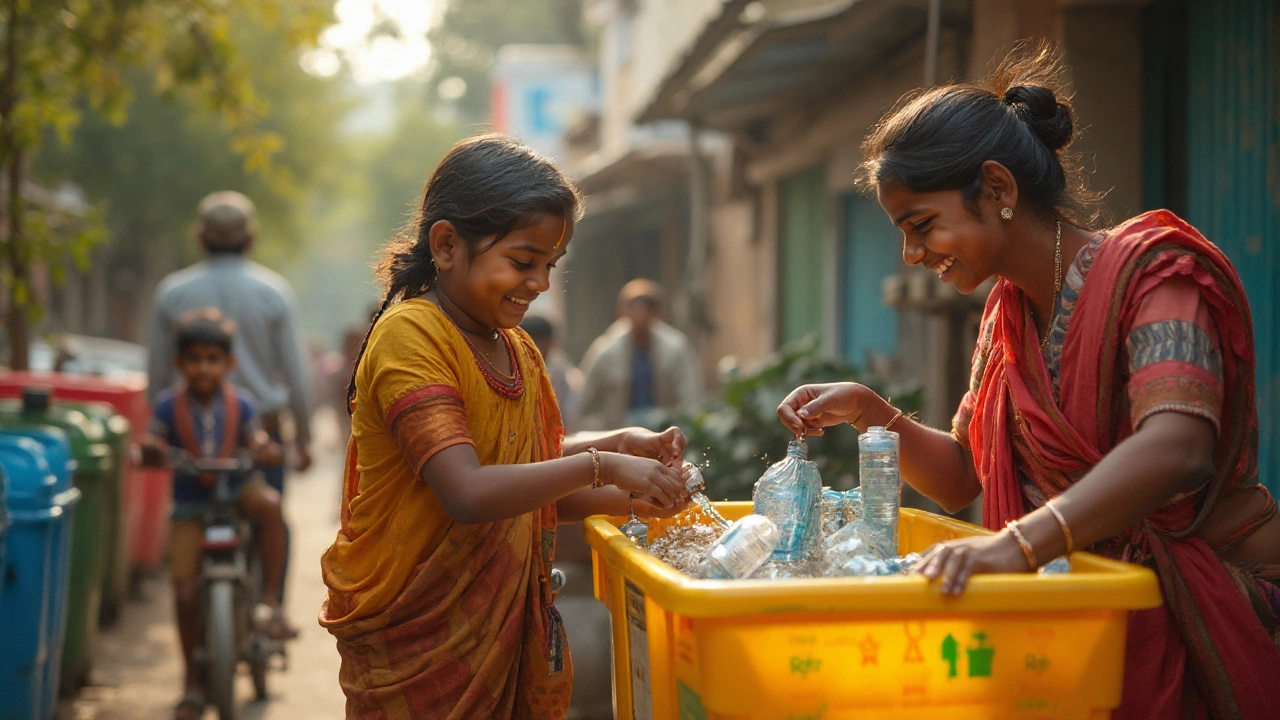
Deposit systems change the math
States with bottle deposit laws (think CA, OR, MI, and others) recover far more PET and aluminum because cash motivates returns-often above 60% return rates, and higher when the deposit is 10 cents. If your state expands or modernizes its bottle bill, your bottles are much likelier to become bottles again.
Why exports still exist
Even with tighter rules, exports remain a pressure valve for specific bales. Canada and Mexico are woven into US supply chains; they have mills and reclaimers that depend on consistent feedstock. Occasional shipments to Malaysia, India, Vietnam, or Indonesia happen when prices and specs line up. Basel Convention updates after 2021 make those routes more controlled, with contaminated loads rejected or returned more often.

How to change the destination: moves for households, businesses, and cities
You don’t control the whole system, but you control what you buy and what you accept. That alone decides a lot of where your stuff ends up.
For households
- Buy the easy winners: Prefer drinks in PET (#1) bottles or HDPE (#2) jugs when you can’t avoid plastic. Skip weird shapes and dark colors.
- Pick refills and reusables: Refill pouches for soap and detergent. Reuse glass jars. Use a water filter and a reusable bottle.
- Use store drop-off for bags/film: Keep a bag for bags. Only clean, dry film. Check the store’s bin instructions.
- Don’t wishcycle: If your city doesn’t list it, it’s probably trash. Wishcycling turns good bales into landfill.
- Check the label: The How2Recycle label is more honest than chasing arrows. Follow the exact guidance.
- Caps on, empty, no bags: Loose items only. Bagged recyclables are often tossed as contamination.
For small businesses and manufacturers
- Audit your packaging: If it isn’t PET (#1) bottle-grade or HDPE (#2) jug-grade, assume low recovery. Switch formats where possible. Use the APR Design Guide to make it recyclable in practice, not just in theory.
- Secure end markets: Don’t just write “we recycle XYZ.” Get purchase agreements or letters from reclaimers. Ask for chain-of-custody and recycled-content certifications (e.g., SCS, UL, or ISCC PLUS where applicable).
- Keep streams clean: Bale by resin; train staff; keep liquids and food out. A 2-3% contamination cut can swing bales from rejected to sold.
- Watch export compliance: If you ship scrap, know the destination country’s Basel status and consent rules. Use reputable brokers; avoid mixed, contaminated loads.
- Plan for EPR fees: Four states (ME, OR, CO, CA) have passed packaging Extended Producer Responsibility laws. Fees will nudge you toward simpler, truly recyclable formats over 2025-2028.
- Use take-back loops: For films, strapping, and pallets, set up closed-loop pickups with your supplier. Clean industrial film has value; post-consumer film does not unless spotless.
For cities and campuses
- Standardize accepted items: Bottles/jugs only for plastics unless you have verified PP markets. Keep the message simple and repeated everywhere.
- Attack contamination: Cart tagging, feedback stickers, and “Oops” notices work. The Recycling Partnership shows double-digit contamination reductions with consistent outreach.
- Right-size service: Weekly trash plus every-other-week recycling often lowers contamination. Give residents big blue carts and clear “yes/no” lists.
- Separate glass if needed: In some markets, glass wrecks MRF equipment and contaminates paper. Consider drop-off for glass.
- Contract for outcomes: Align MRF contracts with bale quality and verified end markets. Ask for quarterly destination reporting.
- Expand drop-offs: Add dedicated film and foam drop-off where you have partners. Don’t add them to curbside if you can’t move the material.
Quick checks & mini‑FAQ
- Is the US plastic recycling rate really 5-6%? For 2021-2023, that’s the best independent estimate (Beyond Plastics/The Last Beach Cleanup). EPA’s older method lands slightly higher, but GAO (2023) still calls it low single digits. The truth most residents feel: the only slam dunks are #1 bottles and #2 jugs.
- Why are caps okay now? Plants can handle attached caps better than loose ones, and reclaimers separate them by density. Check your city’s guidance, but “caps on” is common.
- Are compostable plastics better? Not in your recycling cart. Most won’t break down in backyard compost and need industrial conditions that many facilities don’t offer. If your organics program accepts them, use them; otherwise, they’re landfill.
- Do deposits really work? Yes. Deposit states pull far more PET and aluminum with cleaner quality. That’s why beverage brands like them even when they grumble about logistics.
- What about chemical recycling-should I count on it? Not yet. It’s promising for some streams but small and uneven in 2025. Don’t base packaging or procurement decisions on future capacity.
- Where does exported plastic go now? Mostly to Canada and Mexico, where integrated mills can process it. Some still flows to Malaysia, India, Vietnam, or Indonesia-under tighter controls since 2021.
Field examples (so it sticks)
- Water bottle (#1 PET): Empty, cap on, in the bin. Likely becomes flakes, then a new bottle or fiber. Good odds, especially in deposit states.
- Berry clamshell (PET, different grade): Looks the same as a bottle, but sorting and label glue make it tricky. Many MRFs toss them; check local rules.
- Milk jug (#2 HDPE): A+ material. Save the win by keeping it empty, no food residue.
- Plastic bag (LDPE film): Not curbside. Take to store drop-off. In the cart, it tangles machinery.
- Black takeout tray: Usually a miss. The optics don’t read black plastic well; most plants reject it.
- Foam cup (PS #6): Trash in almost all programs. Foam shatters and contaminates everything.
Policy shifts to watch through 2025
- Extended Producer Responsibility (EPR): Maine and Oregon (2021), Colorado and California (2022) have laws in motion. Expect producer-funded systems to phase in from 2025 to 2028, with fees that reward simpler, recyclable packaging.
- Recycled-content mandates: California already requires minimum recycled content in PET bottles, ratcheting up each year. More states are exploring similar rules, which strengthen markets for clean bales.
- Global plastics treaty: Negotiations continue into 2025. If a strong treaty lands, expect tighter controls on problematic plastics and transboundary waste shipments.
Simple decision tree for everyday choices
- Can I avoid it? Choose a refill, bulk, or reusable. That’s the surest win.
- Is it a #1 bottle or #2 jug? Recycle it. Highest value, best odds.
- Is it film or a bag? Store drop-off only (clean and dry).
- Is it black, foam, or tiny? Trash it. Better to landfill than contaminate the stream.
- Not sure? Check your city’s list. When in doubt, leave it out.
Here’s the kicker: the fate of US plastic waste is mostly decided before you ever touch the bin-at the design and purchase stage. Pick formats that have strong end markets, and you turn a dead end into a loop.
Next steps / Troubleshooting
- If your blue bin keeps getting flagged: Pull out bags, tanglers, food-soiled items, and small bits. Stick to bottles/jugs for plastics unless your city lists more.
- If your business hauler says “we recycle it all”: Ask for bale specs, destinations, and quarterly tonnage by end market. If they won’t share, assume landfill for the marginal stuff.
- If your campus wants zero waste: Start with deposit-return for bottles and cans, switch foodware to reusables, and add staffed sorting stations at events.
- If your city’s contamination is >20%: Try cart-tagging pilots, mailers with clear “yes/no” photos, and reduce accepted items to the money materials. Measure before/after.
- If you want to verify exports: Use trade codes (HS 3915) in UN Comtrade or US Census to see volumes and destinations. Look for spikes that don’t match your contracts.
This isn’t a story about perfection. It’s about probabilities. Aim your buying and sorting at the few formats with strong markets, and you’ll measurably change where your plastic ends up. That’s how you push the system-one bottle, one contract, one policy at a time.

Write a comment